
Filter by
The language used throughout the course, in both instruction and assessments.
288 results for "illustration"

Coursera Project Network
Coursera Project Network
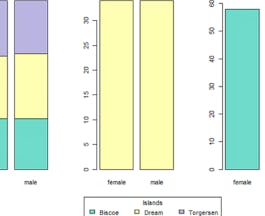
Skills you'll gain: Data Visualization, Exploratory Data Analysis, R Programming

Emory University
Skills you'll gain: Critical Thinking
 Status: Free
Stanford University

Johns Hopkins University
Skills you'll gain: Mathematics, Algebra, Data Analysis

Skills you'll gain: Basic Descriptive Statistics, Data Analysis, Data Science, Data Visualization, Data Visualization Software, Python Programming
 Status: Free
The World Bank Group

Coursera Project Network
University of Michigan
Skills you'll gain: General Statistics, Probability & Statistics, Regression, Statistical Analysis, Statistical Tests, Correlation And Dependence, Data Analysis, Plot (Graphics), Statistical Visualization, Statistical Programming, Bayesian Statistics

Dartmouth College

IE Business School
Skills you'll gain: Marketing, Brand Management, Design and Product, Product Strategy, Customer Relationship Management, Finance, Leadership and Management, Product Management

University of Michigan
Skills you'll gain: Human Learning
In summary, here are 10 of our most popular illustration courses
- Manipulate Coulomb's Law Concepts using Wolfram notebook: Coursera Project Network
- Visualization for Statistical Analysis: Coursera Project Network
- The Bible's Prehistory, Purpose, and Political Future: Emory University
- Antibiotic Stewardship: Stanford University
- Applied Calculus with Python: Johns Hopkins University
- Visualizing & Communicating Results in Python with Jupyter: Codio
- From Climate Science to Action: The World Bank Group
- Create your UX portfolio with Adobe Portfolio: Coursera Project Network
- Fitting Statistical Models to Data with Python: University of Michigan
- Question Reality: Cosmos: Dartmouth College


